debugging
The Page Looks Broken. Start With the Console and Network Evidence.
Use captured browser logs alongside screenshots to investigate a UI problem before choosing a code change.

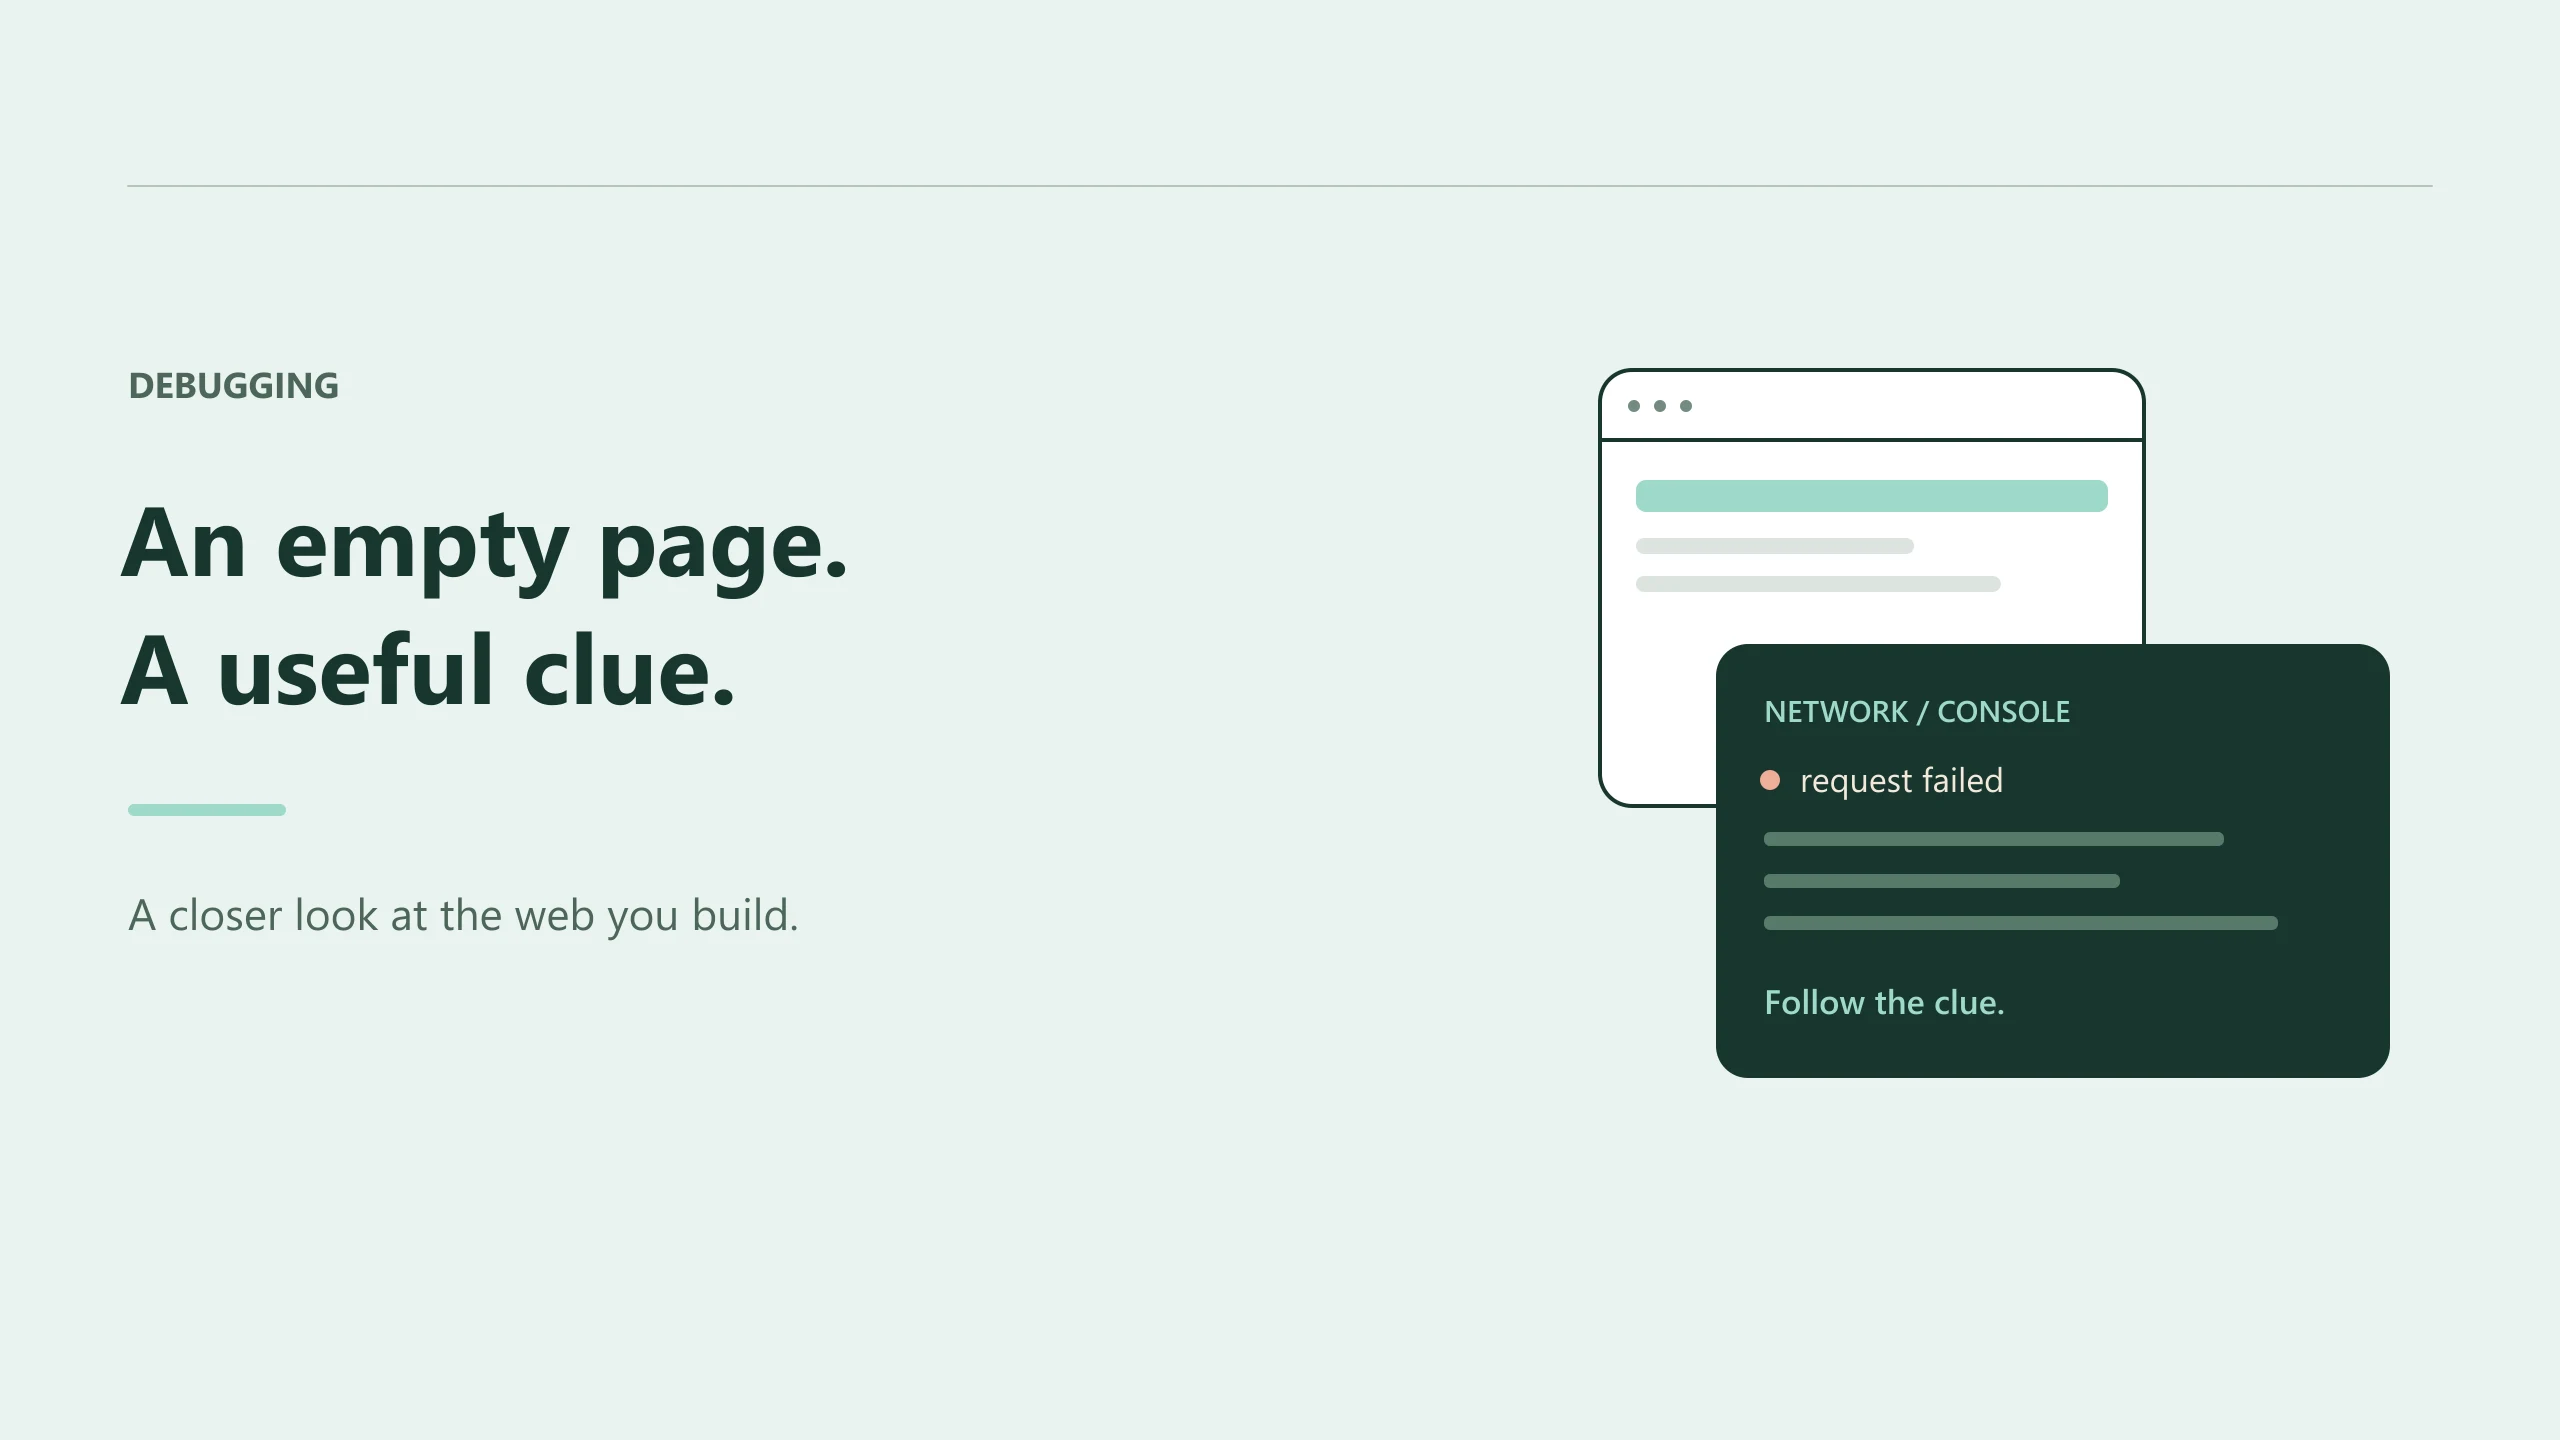
An empty product grid looks like a frontend problem.
It might be. It might also be the visible result of a failed request, an unexpected response, or an exception that interrupted rendering.
When you're working with a coding agent, it's tempting to describe the symptom and let it start editing. A little browser evidence can save you both from choosing the wrong first fix.
Here's a practical investigation using a hypothetical product page. The examples describe what to look for; they aren't results from a real run.
Reproduce the symptom under known conditions
Open the affected route and record the state: signed in or signed out, filters selected, environment, browser, and relevant viewport.
Then capture that condition with logging enabled where supported. In Preveo, Console Errors and Network Errors are available Use Cases. An MCP-connected agent can discover their configuration and submit the appropriate capture job.
For example:
Review the product page's console and network evidence in the preview environment. Capture the page with logging enabled, inspect the saved screenshot and logs, and identify failures that may explain the empty grid. Don't change the code until you've connected a finding to the relevant implementation.
If the grid fails only after a filter click, a normal page-load capture may not reproduce it. Arrange the required interaction with suitable tooling or provide evidence from that state. Be explicit about what was actually exercised.
Read the screenshot and logs together
Suppose the screenshot shows the heading and navigation, but no cards. A saved network entry shows that the product request failed.
That's a promising lead. Check whether it's the request the grid relies on, whether the failure belongs to the same capture, and whether the environment was expected to serve it.
A development preview might have the wrong API base URL. A signed-out cloud browser might receive a different response from your signed-in local browser. A test backend might simply be unavailable.
Each possibility points to a different next step. Changing the card component won't resolve an endpoint that the preview can't reach.
When you need deeper request details than the saved evidence provides, reproduce the problem in browser tools. Chrome's Network panel guide explains how to inspect request status, timing, and related details. Keep a note of which observations came from that follow-up rather than the original capture.
Treat errors as clues with a context
Not every warning explains the page you're reviewing.
A blocked analytics request may be unrelated to the empty grid. A missing image might affect one card while leaving the data load intact. An exception in the product rendering path deserves a different level of attention.
Ask the agent to connect each candidate failure to the affected feature. It can trace the request through the code, inspect response handling, and check what happens when data is absent.
It should distinguish a direct observation from a proposed explanation. "The product request returned an error" and "the grid assumes success and therefore renders nothing" are two claims. The second requires inspection of the implementation.
Retrieve the part of the log you need
Preveo's get_layer_view can return saved log entries when includeLogs is enabled. Responses are bounded, with paging information for additional entries.
If the relevant event isn't in the first page, inspect the available continuation rather than assuming you've read everything. If there are no saved logs, say that the evidence is unavailable for that capture.
Logging has to be enabled for the run. Retrieving a capture afterward can't reconstruct browser events that weren't collected.
The configuration is available through Use Case discovery; the current execution option uses jobProps with $$$WriteLogs$$$ set to "1". Let the agent read the live tool contract rather than rely on an old example pasted into a prompt.
Choose a fix that addresses the observed cause
If the preview has the wrong endpoint, correct the environment configuration. If a valid empty response crashes the view, handle that state. If a request fails intermittently, investigate the failure and decide what recovery the user should see.
These changes may belong in different parts of the application, even though they all began with an empty grid.
Run the focused code checks appropriate to the change, then reproduce the original browser condition. Inspect both the visible result and the relevant logs again.
A recovered grid with a continuing exception deserves another look. So does a quiet console while the page still shows the wrong content.
Save the new evidence beside a clear description of the fix. The Preveo MCP guide covers connecting the agent so that investigation can stay with the project.
The next time a page looks broken, spend a moment finding out what the browser experienced before asking the agent to rewrite the component. It's often the shortest route to a change you can explain.
 Install Browser Extension